
US Trade Deficit Jumps 42.2% to $77.6 Billion in May
The U.S. international trade deficit in goods and services widened to $77.6 billion in May 2026, up $23.0 billion from the revised $54.6 billion recorded in April. During the month, exports fell 3.2% to $317.7 billion, while imports rose 3.3% to $395.3 billion. May exports declined by $10.5 billion from April, while imports increased by […]

The U.S. international trade deficit in goods and services widened to $77.6 billion in May 2026, up $23.0 billion from the revised $54.6 billion recorded in April. During the month, exports fell 3.2% to $317.7 billion, while imports rose 3.3% to $395.3 billion.
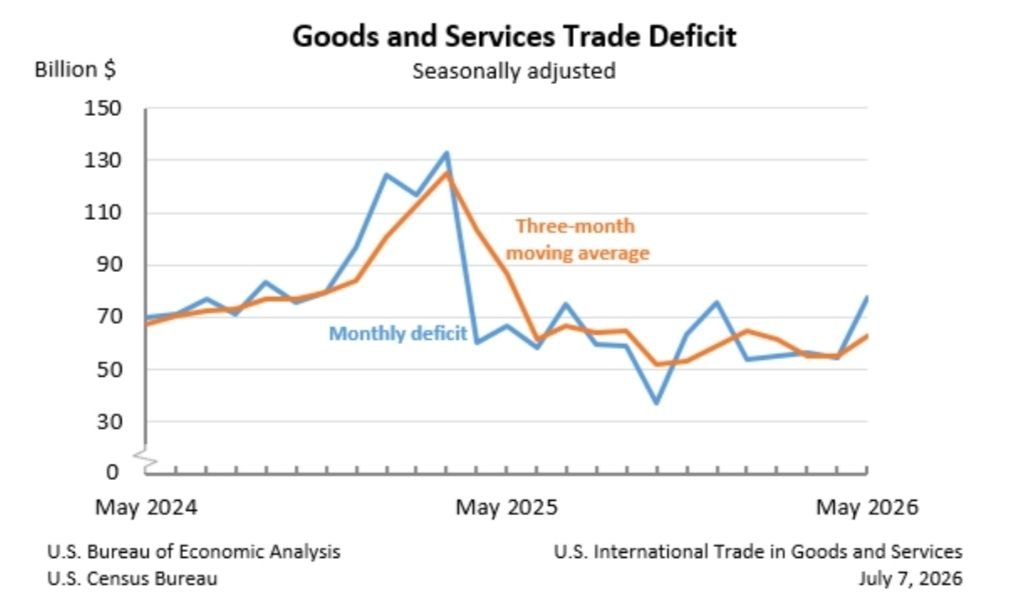
May exports declined by $10.5 billion from April, while imports increased by $12.5 billion. The wider trade deficit reflected a $23.6 billion increase in the goods deficit to $106.5 billion, partly offset by a $0.6 billion rise in the services surplus to $28.9 billion. So far in 2026, the goods and services deficit has decreased $203.9 billion, or 40.6%, compared with the same period in 2025. Exports have increased $164.7 billion (11.7%), while imports have decreased $39.2 billion (2.1%).
The three-month average trade deficit increased $7.5 billion to $62.9 billion for the period ending in May. Average exports rose $2.0 billion to $321.5 billion, while average imports increased $9.5 billion to $384.5 billion. Compared with the three months ending in May 2025, the average trade deficit was $23.8 billion lower, with average exports up $36.1 billion and average imports up $12.4 billion.
Goods exports fell $11.3 billion to $210.6 billion, led by declines in industrial supplies and materials ($5.5 billion), capital goods ($3.5 billion) and consumer goods ($2.1 billion). However, services exports increased $0.8 billion to $107.1 billion. On the import side, goods imports rose $12.3 billion to $317.0 billion, driven by higher imports of consumer goods ($3.5 billion), industrial supplies and materials ($3.1 billion), automotive vehicles, parts and engines ($2.2 billion) and capital goods ($1.1 billion). Services imports increased $0.2 billion to $78.2 billion.
In inflation-adjusted terms, the real goods deficit increased $15.8 billion, or 18.7%, to $100.0 billion in May. The United States recorded its largest trade deficits with Vietnam ($20.6 billion), Mexico ($20.1 billion), Taiwan ($19.4 billion), China ($14.5 billion), the European Union ($9.3 billion), Canada ($7.0 billion), Germany ($5.7 billion), Malaysia ($4.7 billion), South Korea ($4.4 billion) and India ($4.1 billion). The next U.S. International Trade in Goods and Services report, covering June 2026, will be released on August 4, 2026.
Related News

India, Israel Complete Second Round of Free Trade Agreement Talks

India’s Services Exports Hit Record USD 421.3 Billion in FY26

India’s July Flash PMI Slows to 54.3 as Inflation Pressures Intensify

US Imposes Section 301 Tariffs on India, China, EU and 57 Other Economies

India Records 21% Rainfall Deficit as Monsoon Lags, Govt Rules Out Crop Impact